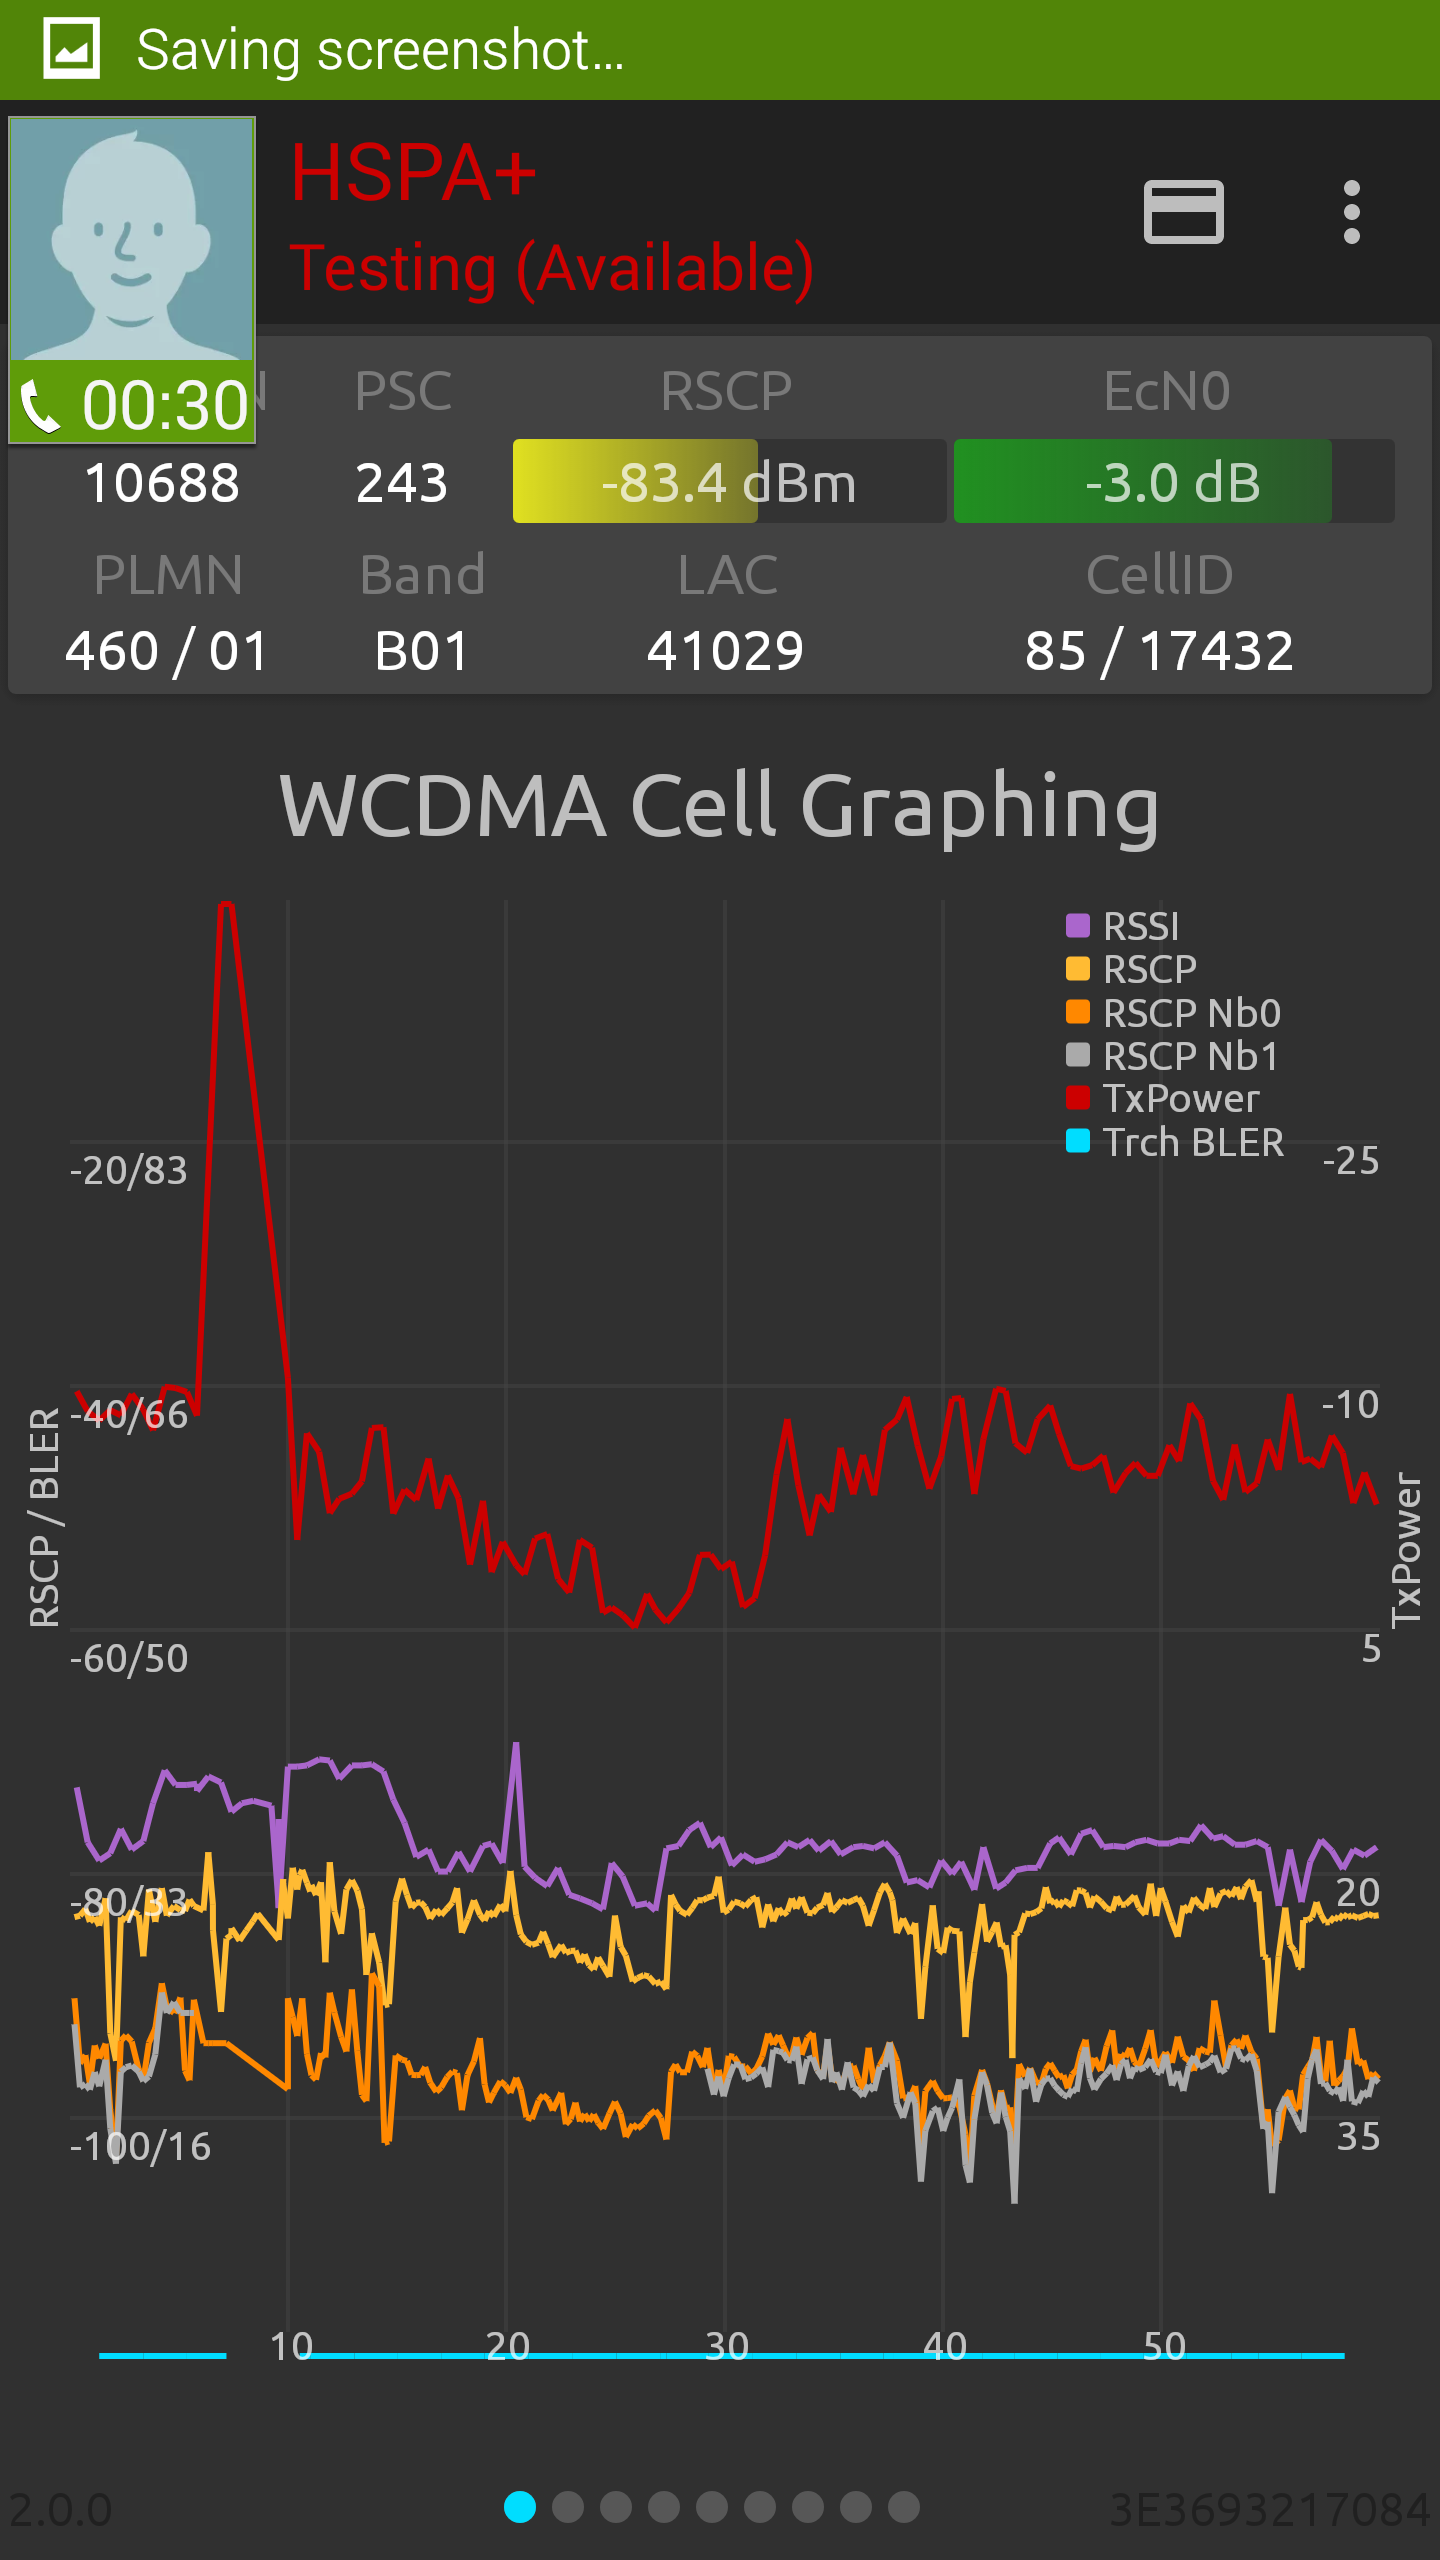
WCDMA Cell Graphing
|
The chart shows the latest 60 seconds. Each label “<n>” on the x-axis means “n seconds ago”. The y-axis has both dBm and percent scale marks. RSSI: Received Signal Strength, equal to UTRA Carrier RSSI. SIR: Signal-to-Interference Ratio (dB). TxPower: UE Transmit Power (dBm). TrCH BLER: Block Error Rate in percent, average taken over all downlink transport channels (DCH only).
|

